Problem:
Huge drop-off rate of the page before check-out
Data analysis
I analyzed user behavior using tracking data, screen recordings, and click maps to identify where users dropped off. This helped uncover pain points in the interface and friction in the purchase flow, especially before the payment step.
Data track
Revealed user paths and where most drop-offs occurred—especially before reaching the payment step. Helped pinpoint friction in the flow.
Recording
Screen recordings showed hesitation and confusion during plan comparison and personal info input. Users often paused or bounced.
Click map
Highlighted where users clicked most—and what they ignored. Many clicks were on non-interactive elements, showing unclear UI hierarchy.
Old interface flow
Users enter the app and request a fast quote by selecting their destination and trip length. They browse products with different benefits and policies. After selecting a product, they choose a plan based on coverage options. Once they’re happy with the plan, they input personal details and proceed to payment.
Unlike school projects, this real-world project required me to work with large-scale data analysis and user behavior tracking. The company provided recordings of user interactions and conversion rates for each step. I noticed a significant drop-off before the payment stage, so I analyzed the available data and conducted additional research to understand why users were leaving.
Design Sprint:
Led design sprints to explore that "Decision-making" is the pain point
To help myself understand this complicated insurance system, I proposed one design sprint in my first few weeks to quickly get familiar with the market and existing workflow,
I analyzed conversion rates and user recordings to map out the journey, and identify problem areas. After brainstorming solutions, I tested prototypes through A/B testing, refined our designs, and finally handed them off to the development team for implementation.

User journey:
Through this design sprint, the key work I did was making a comprehensive user journey of each action when consumers are buying an insurance product.
I tracked page activity to identify drop-off points and observed recordings to understand user confusion. By examining different phases of the purchasing experience, I noticed some patterns of the biggest drop-off
and I will dive into them later.

Map out conversion to the journey
I will take travel insurance as an example to better understand the flow. By mapping the conversion rate onto the user flow, I identified clear drop-off points—which were mainly when users choose a product, select a plan, and the moment before payment.
This indicates that users often leave during decision-making moments, highlight that they need a solution to reduce their cognitive load.
How might we reduce the mental load for customers and facilitate their decision-making? And my design solution should focus on these three pages.
Choose Product
Users struggled to compare similar-looking insurance options. I simplified product cards with clear price, benefit highlights, and recommendation tags to help them decide faster.
Select Plan
Long benefit tables created decision fatigue. I redesigned the layout to highlight key differences, added scrollable plans, and reduced unnecessary details upfront.
Paymnt
Users dropped off due to lack of clarity and confirmation before paying. I improved the summary page with clear visuals, editable fields, and a reassuring breakdown of costs and personal info.
Iteration:
Reduce the mental load for customers and facilitate their decision-making
To figure out how to reduce customers' mental load and reduce drop off rates, we conducted several rounds of user testing and A/B testing. Ultimately, the most effective way to measure success was by tracking conversion rates.
# Choose Product
After a fast quote, Igloo will generate products for customers. When choosing a product, I noticed that customers frequently switched back and forth to compare benefits and prices.
Since many insurances look similar and customers are unfamiliar with benefits, decision-making takes a longer time.
By watching recordings and conversion rates, I figured out three key pain points on the page and offered suggestions
Price compare
Before: Price and discount information were separated, making it hard for users to compare at a glance.
After: Prices, discounts, and cashback are shown together with clear formatting, making it easier to understand the total cost.
Suggestion tag
Before: No guidance was provided, leaving users unsure which product was best for their needs.
After: A “Recommended for [trip type]” tag helps users make quicker decisions based on their travel context.
Key highlight
Before: Benefit descriptions were long and hard to scan.
After: Key highlights are listed clearly, helping users compare core benefits without reading the full policy.
# Select Plan
Insurance is a complex system, and while Igloo provides detailed benefits as a long table for transparency, it also creates a heavy mental load for our customers.
I also noticed that some consumers will quit at this page but they would come back later. My hypothesis was that customers want this product, but they need more time to rethink.
By watching recordings and conversion rates, I figured out three key pain points on the page and offered suggestions
Highlight tag
Before: Product labels were unclear, and users struggled to identify coverage types.
After: Added clear tags like "Instant Issuance" and "Covid Add-On" to help users quickly understand key features at a glance.
Share option
Before: No way for users to save or share their plan, causing drop-off from users who needed more time to decide.
After: Introduced a share button so users can easily revisit or send their selected plan to others.
View all benifits
Before: The table felt crowded and overwhelming, with too much info shown at once.
After: Introduced a “View all benefits” button and swipe-to-view layout to reduce cognitive load while keeping details accessible.
# Before payment
Before finalizing their purchase, customers want to double-check their information and benefits for confidence.
However, I noticed there was a lack of clarity on the summary page.
By the time customers reach this stage, they’ve already gone through several decision-making steps, and their memory of previous selections may be blurry. This uncertainty can create hesitation, causing some users to abandon their purchase instead of continuing with payment.

Visual summary
Before: Quote details and pricing were shown in plain text with limited structure, making it hard to understand at a glance.
After: Added a visual summary bar with icons and clear formatting to help users quickly review coverage, trip details, and pricing.
Edit option
Before: No option to easily update personal or coverage info without restarting the process.
After: Introduced a clear “Edit” button to allow users to revise traveler info directly from the summary page.
Insured overview
Before: Traveler info was missing, making it hard for users to confirm what they had entered.
After: Displayed a full traveler information section for easy review, reducing hesitation before payment.
# other iterations
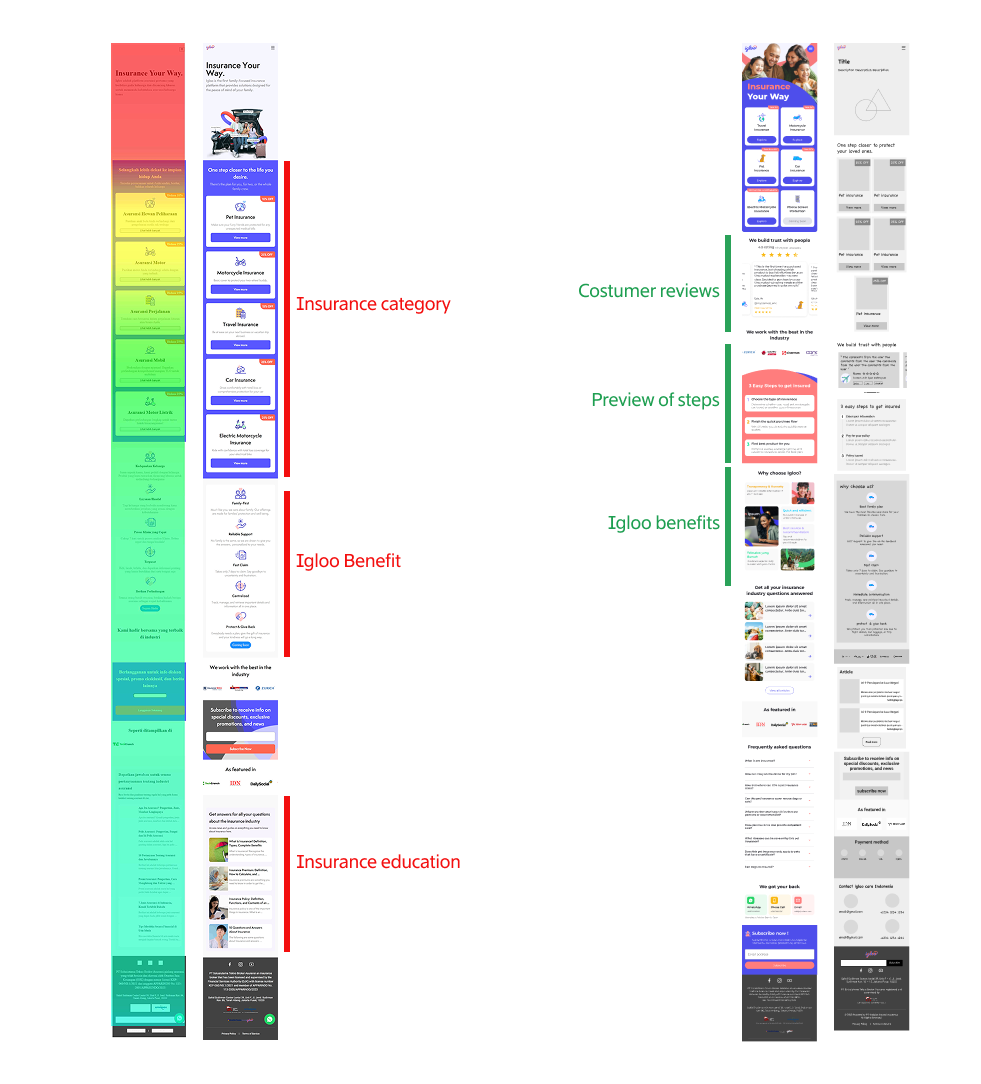
Besides the iteration of the decision-making phrase, I also noticed many other pain points that caused the drop-off. For example, the home page.
Click map and scroll analysis showed a drop-off rate before the quote stage, with users only focusing on the top 20% of the page. The long landing page overwhelmed users early on. And it wasted room for more information to convince customers at the first sight.
My design decisions focused on:
1. Prioritizing key information upfront—making it clear, concise, and actionable.
2. Restructuring the layout—so the first screen provides immediate value, while the rest of the page supports decision-making.
3. Reducing friction—ensuring users can quickly get a quote without feeling overwhelmed.
By refining the information hierarchy and visual layout, we aimed to increase engagement and trust, leading to higher conversion rates. So on the homepage, I iterated three main sections: Preview of steps, Costumer reviews, Igloo benefits.
Final design:
Redesigned App and responsive website of Igloo online insurance, increasing the 23% drop-off
While I designed the entire purchase experience for this product, I initially showcased only the three key interfaces. Here is the full set of interface pages I created.

As I improved the UI/UX and design system for both the app and website. Data showed most customers used mobile devices, but since some still purchased via laptops, I also designed the website with a responsive layout to ensure a smooth experience across all screen sizes.
Overall, our efforts led to a 23% increase in sales over four months, it proved my UX design with directly data by business success.
Reflection:
Design for novel and complex system in real word.
During my eight-month experience, I conducted two rounds of design sprints.
The first sprint was all about exploring possibilities, as I was new to the project. My design lead encouraged me to bring a fresh perspective and contribute as many ideas as possible. By the third month, after refining our interface, I had a deeper understanding of insurance complexities. The second sprint was more focused and feasible, it was a co-design with the local management, dev, and data teams.
This experience was a different perspective and experience from my school projects, where I can only collaborate with designers of a similar background. In a real-world setting, working with a diverse team taught me that success isn't just about better design solutions, but about fulfilling goals of the entire team.
Data driven and decision making
I learned to analyze user behavior, conversion rates, and click maps to back up design decisions with real data.
Diverse and collaboration
I collaborated with cross-functional teams (PMs, devs, data analysts), learning how to align design with shared goals and constraints.
Learning curve on complex system
I quickly ramped up on a novel and regulated domain, adapting my design thinking to fit a high-stakes, real-world product.